LiveUniversity research office, Egypt
A research impact dashboard for a university
What research costs, what it returns, on one screen for leadership.
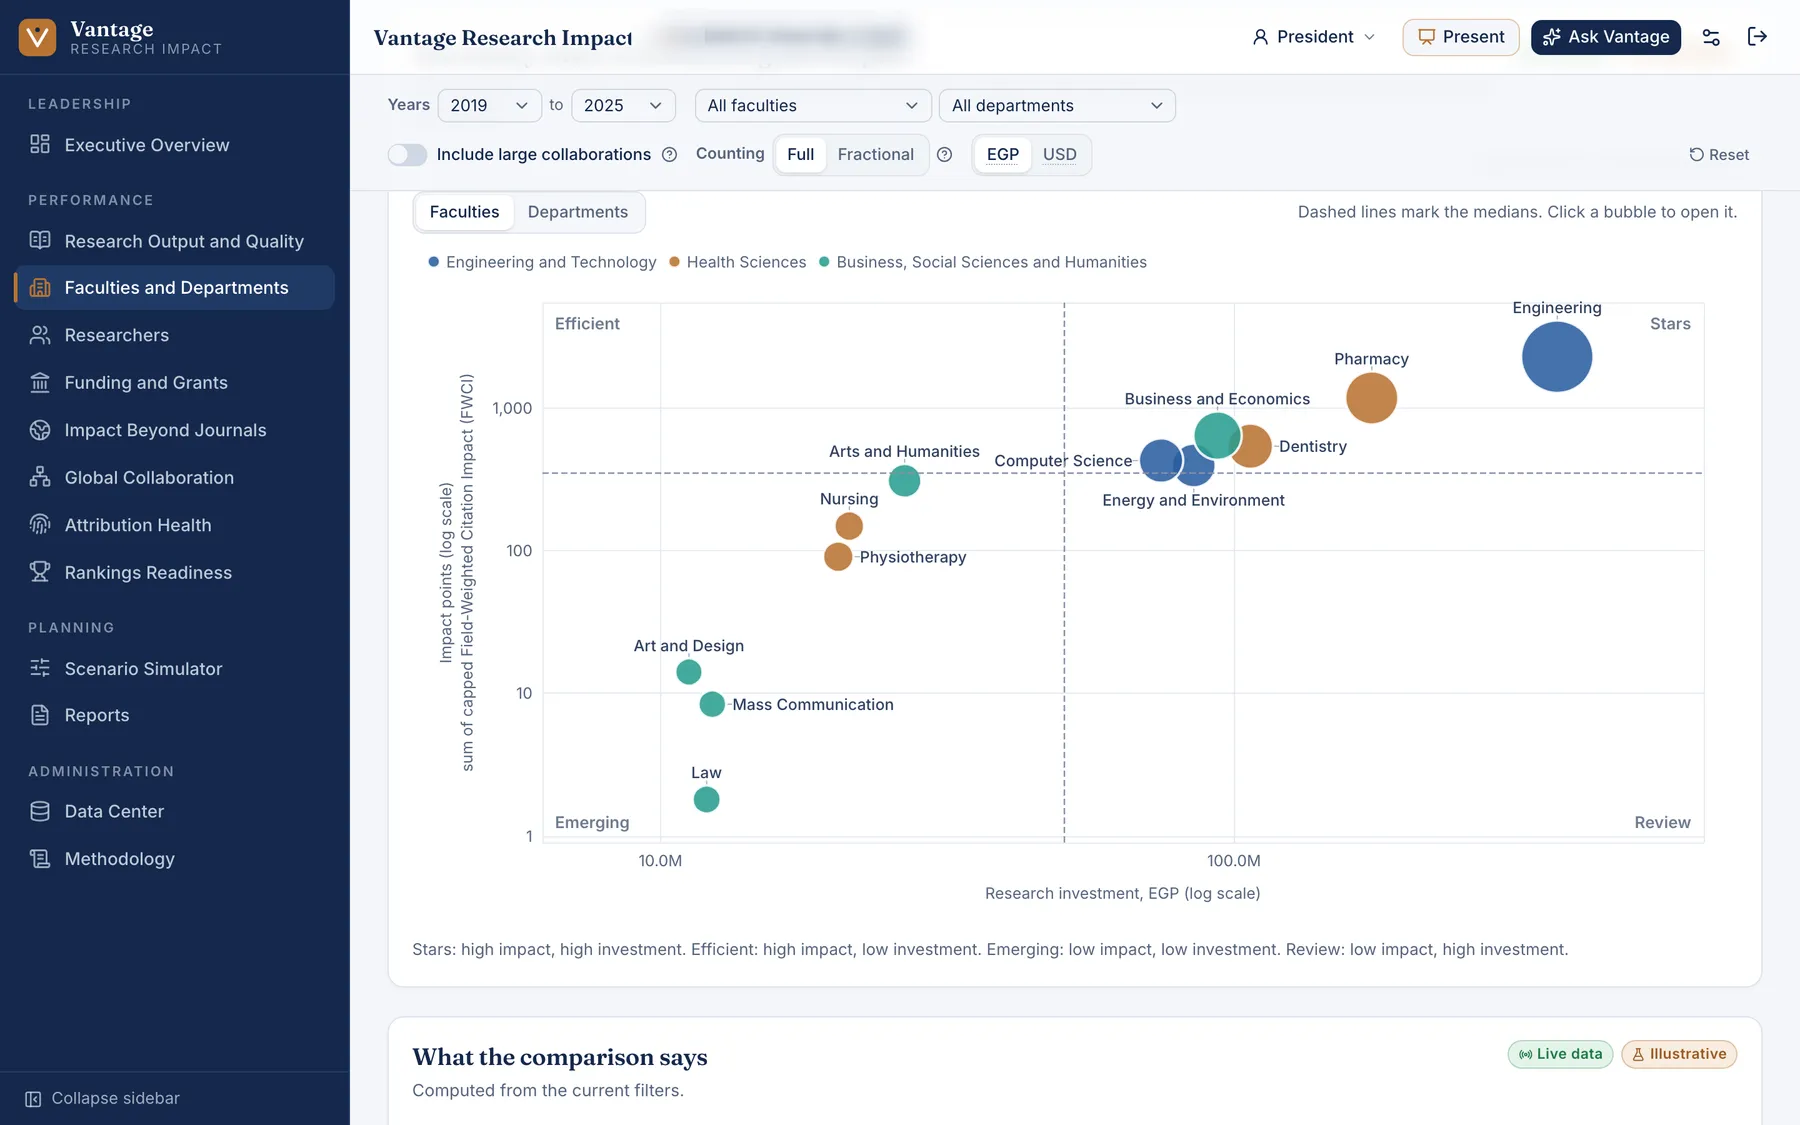
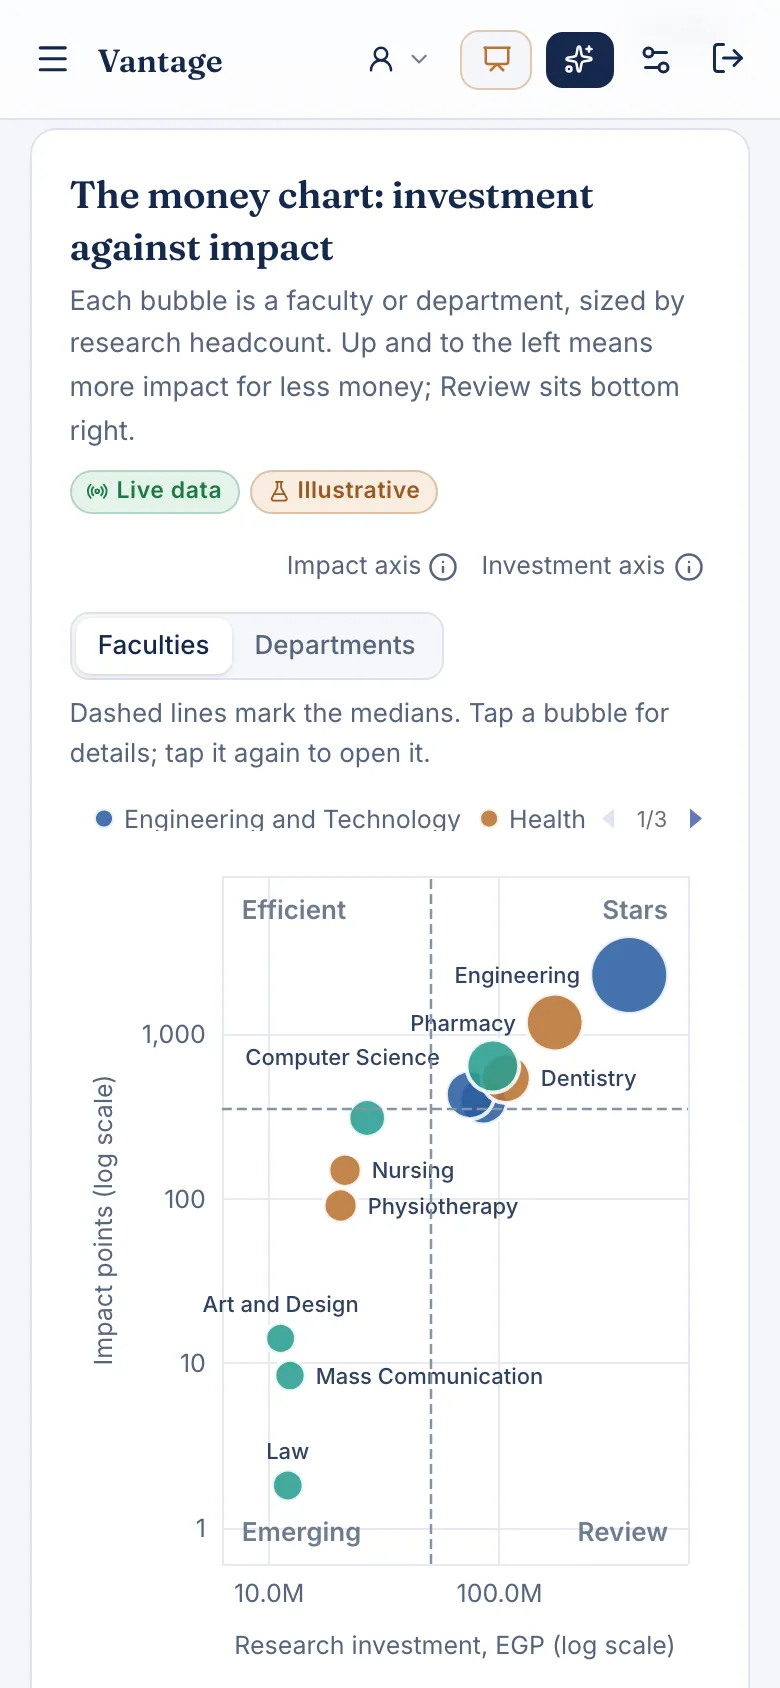
Cost figures are illustrative, as labeled on screen. University name blurred.
The problem
A university wanted to measure the return on its research spending and show it clearly to leadership. No tool existed to do it.
What we built
A dashboard that relates research spending to research output by faculty, department and researcher, with an illustrative cost model where real figures were not yet available. A leadership presentation built from the same numbers.
What changed
Live and presented to university leadership as the basis for measuring research return.
- presented to university leadership
- Live

Got 30 minutes?
We'll show you where artificial intelligence pays off in your operation. No cost, no obligation, no pitch deck.
Book 30 minutes with Mohamed