Production visibility from line to boardroom
Manufacturing dashboards that show OEE, scrap and downtime the same way in every plant
Vantage Systems builds manufacturing dashboards that pull from your manufacturing execution system (MES), enterprise resource planning (ERP) system and machine controllers to show overall equipment effectiveness (OEE), scrap and downtime reasons for every line and shift. The same numbers roll up from the line to the plant manager to corporate, calculated one way, so a plant review starts with the problem instead of an argument about whose spreadsheet is right.
Key facts
- What it is
- Live production views for operators, supervisors, plant managers and executives, built on one data model.
- Who it is for
- Discrete and process manufacturers, from a single plant to a multi-site group.
- Reads from
- MES, ERP, historians, programmable logic controllers (PLCs), quality systems and maintenance records.
What should a manufacturing dashboard show first?
Overall equipment effectiveness by line and shift, broken into availability, performance and quality, because that split tells a supervisor where the lost time went. Next to it go scrap by product and cause, and downtime ranked by reason and minutes.
Downtime is only useful if the reasons are honest. We design the reason codes with your supervisors, keep the list short, and show unassigned downtime as its own bar so a vague category cannot hide a real problem.
- Equipment effectiveness against target, live and by shift
- Scrap and rework by stock keeping unit (SKU), line and defect
- Top downtime reasons this shift, this week and this month
- Schedule attainment: what was planned against what was made
How do you join MES and ERP data without a long data project?
We map only the tables and tags the first screens need, then widen the scope as screens are added. Production counts and states come from the MES or controllers, orders and standard costs from the ERP, and the join happens in a small, documented data layer we build and maintain.
Where a plant has no MES, we read machine states straight from the controllers and add a simple operator screen for reasons and counts. Our data infrastructure work covers the layer underneath when several plants run different systems.
How does shift handover and corporate roll-up work?
Each shift closes with a handover view: what ran, what stopped, open issues and actions carried to the next crew, signed by the outgoing supervisor. It replaces the whiteboard photo and the hallway conversation with a record the incoming supervisor can read in a few minutes.
Corporate sees the same measures, defined identically in every plant, so comparing sites is fair. Executives who want the wider financial picture can read our thinking on executive dashboards.
What we build for manufacturers
Line and shift screens
Large-format views on the floor showing equipment effectiveness, counts and the current stop reason.
A downtime and scrap workbench
Reasons, causes and trends for supervisors and engineers, down to the individual stop.
Shift handover records
A structured close-out each shift, carried forward until every open item is resolved.
A plant to corporate roll-up
One definition of each measure across sites, with drill-down from group totals to a single line.
More for this industry and service
- Operational dashboards: the full service
- Manufacturing and machine builders: everything we build
- Customer relationship management for machine builders
- Predictive maintenance for food and beverage plants
- Predictive maintenance for packaging machine builders and plants
- Quality inspection for food and beverage plants
- Operational dashboards for construction contractors
- Operational dashboards for healthcare groups
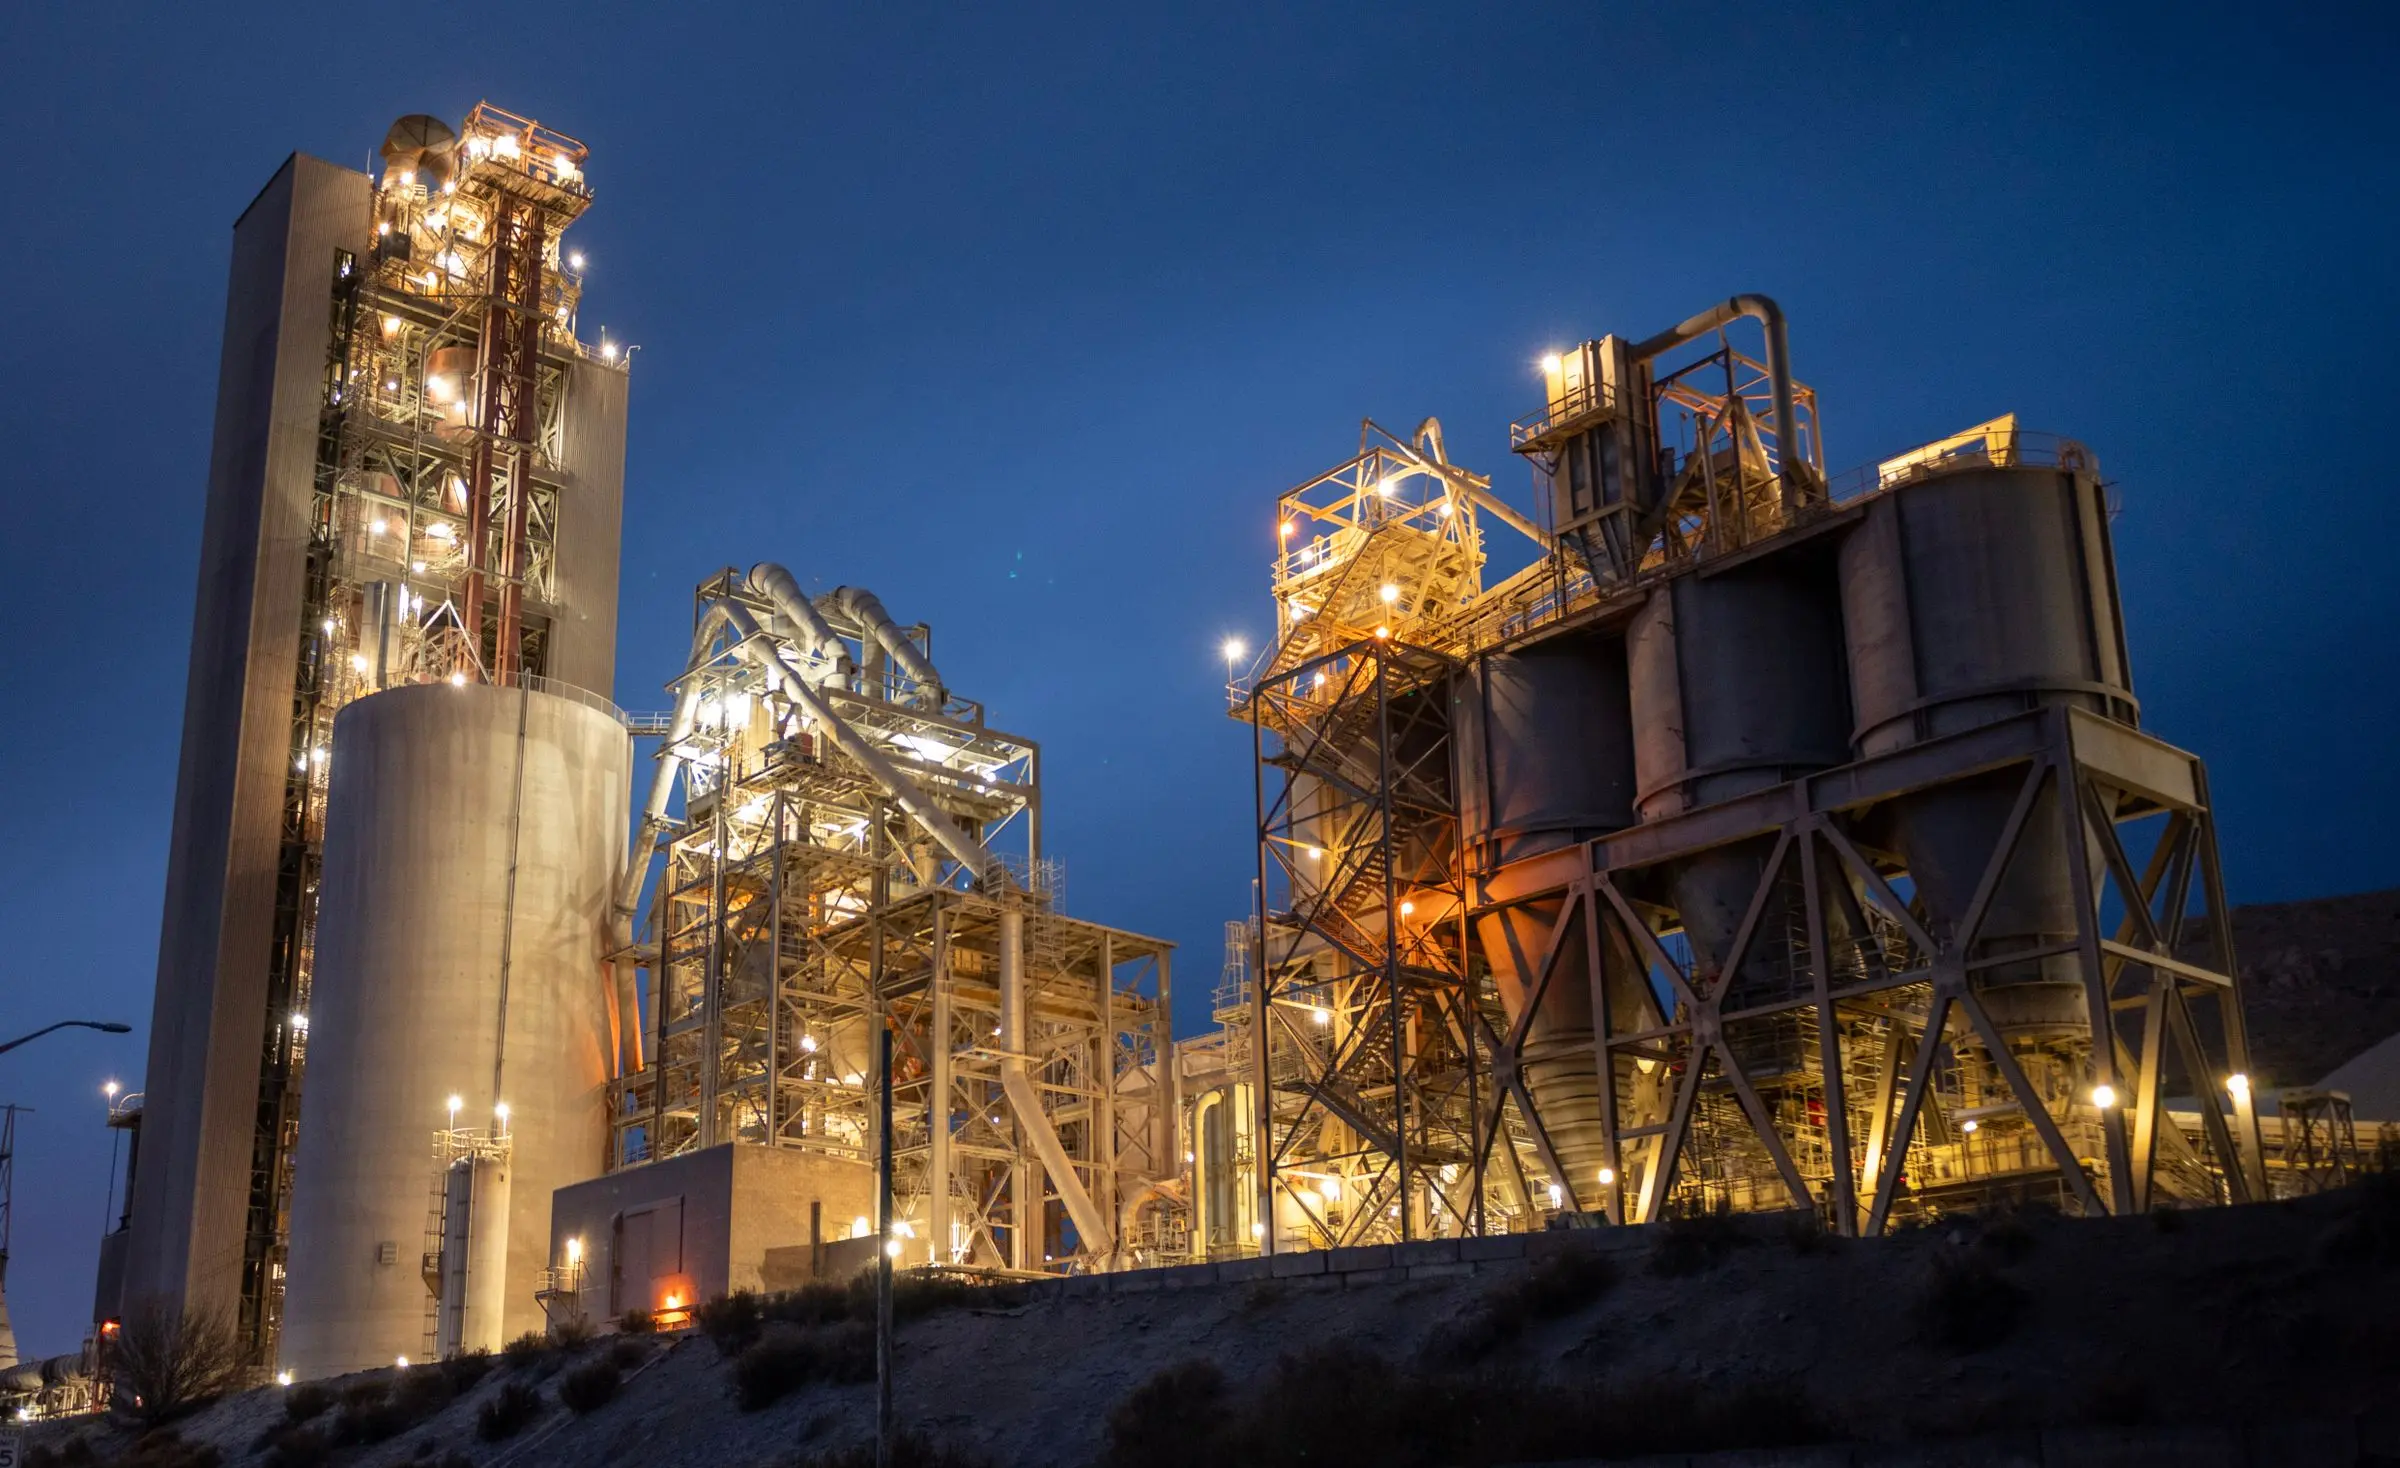
In progressCement manufacturer, Pakistan
A plant-wide view now being deployed
For a cement manufacturer in Pakistan, we are connecting plant and business systems into one view of production and operations, replacing separate reports from each department. The deployment is in progress. Read about the cement plant visibility project.
Read the full storyHow an engagement works
Trace how the floor counts
We review with operators and supervisors how counts, stops and scrap are recorded today, from controller signals to any paper sheets kept at the line.
Fix the definitions
Plant and corporate agree how each measure is calculated before a single chart is drawn.
Connect one line first
A pilot line goes live with real data, and supervisors correct reason codes and screens week by week.
Extend to every plant
Remaining lines and sites join the same model, and we maintain the data feeds as systems change.
Frequently asked questions
Do we need an MES before building dashboards?
No. Many plants start from controller data and a simple operator input screen. An MES helps, but it is not a prerequisite.
How do you calculate equipment effectiveness?
As availability times performance times quality, using ideal cycle times and planned time that your engineers sign off. The definitions are written down and shown on the dashboard itself.
Can operators enter downtime reasons from the line?
Yes. A touch screen or tablet at the line prompts for a reason when a stop passes the threshold you set, which is how unassigned downtime shrinks.
Can the dashboards predict failures too?
They can show predictions if you add them. Our predictive maintenance for food and beverage plants and packaging lines feeds health scores into the same views.
Will this work across plants on different ERP systems?
Yes. Each system is mapped into one shared model, so corporate compares like with like even when the plants run different software.
Can we see it in our existing BI tool?
Often, yes. The data layer can feed a business intelligence (BI) tool you already license as well as the screens we build. See our operational dashboards approach.
Related
- ServiceOperational dashboardsVantage Systems builds custom business dashboards on live pipelines from your ERP (enterprise resource planning), field and finance systems, with one definition per number. See how they work.
- IndustryManufacturing and machine buildersVantage Systems builds failure prediction, quality models, plant dashboards and aftermarket systems for manufacturers and machine builders. See where to start.
- ServiceData infrastructureVantage Systems does data infrastructure consulting that ends in working pipelines, a warehouse and one agreed definition for every number your leaders use.
- Operational dashboardsFor logistics and distribution companiesLogistics dashboards that join warehouse and transport data to show on-time in full, dock-to-stock time, cost per shipment and carrier scorecards by customer.
- InsightExecutive dashboards that leadership actually usesWhy most executive dashboards die and how to build one leadership opens every week: one definition per number, a decision per chart, drill paths and fresh data.
- PricingHow we priceFixed scope and a fixed price for each phase, and what drives the cost of a build.
Built for operators with real scale. Most engagements are scoped in the tens of thousands of dollars and up.
Start a conversation.
Tell me what's slowing your operation down. I read every message myself and reply within one business day.